Analyzing Trends in the Income Statement Dashboard
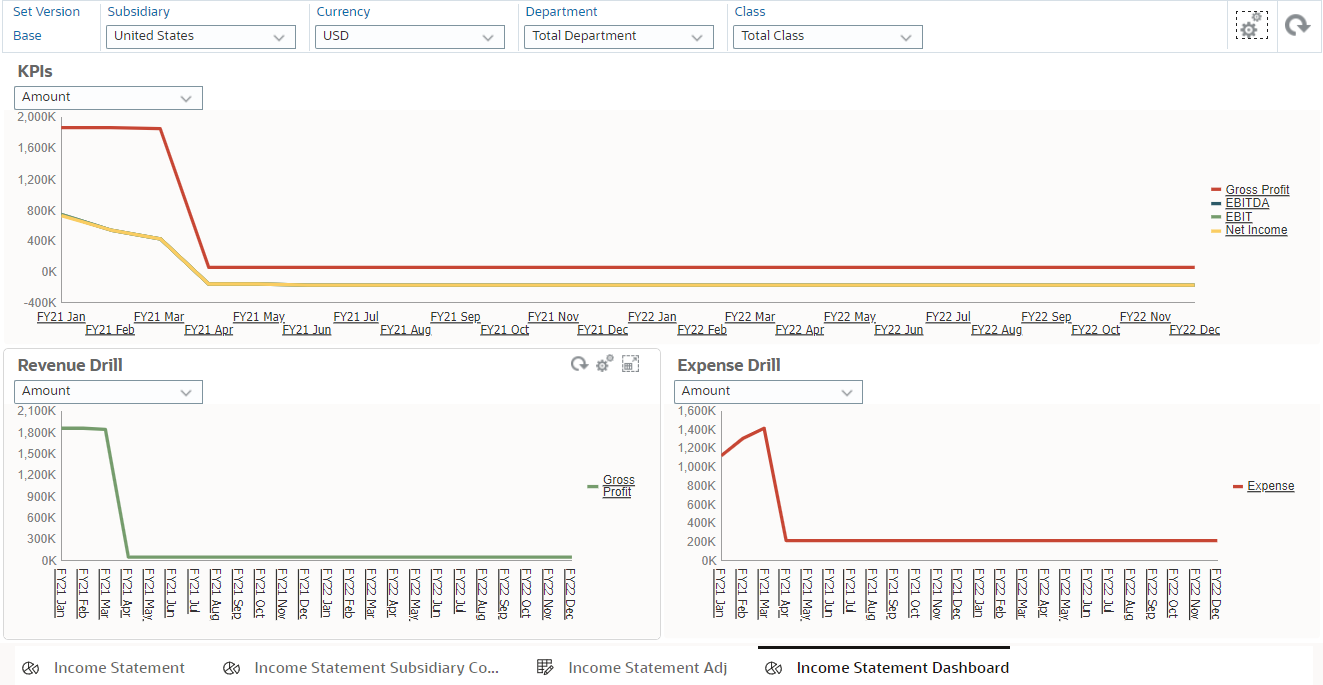
The Income Statement Dashboard displays key metrics and trends for Actual and Budgeted values of the Income Statement. You can view trends as an amount or percentage of total revenue.
You can use the Income Statement Dashboard to:

- Analyze the Income Statement's key performance indicators (KPIs).
- Evaluate revenue and expense trends by the selected Department, Class, Subsidiary, Currency dimension members.
- Drill into the Revenue Drill and Expense Drill trends at a detailed level.
This section includes general instructions on how to use the following interactive subforms in the Income Statement Dashboard:
- KPIs – Displays the Gross Profit, Earnings Before Interest, Taxes, Depreciation, and Amortization (EBITDA), Earnings Before Interest and Taxes, (EBIT) and Net Income trends for the current and next financial years.
- Revenue Drill – Displays the Gross Profit trend as an amount or a percentage of total revenue. The subform includes the option to drill into the Gross Profit trend and then further into the detailed Income and Costs of Sales trends.
- Expense Drill – Displays the Expense trend as an amount, percentage of total expenses, or percentage of total revenue. The subform includes the option to drill into the trend details by expense type and Account.
To analyze the Income Statement's key metrics and trends:
You can maximize and refresh each trend graph individually by clicking the Maximize icon  and Refresh icon in each subform
  , respectively.
- From the Home page, go to Financials > Income Statement.
- Click Income Statement Dashboard at the bottom of the page.
- In the Point of View (POV), select a Version, Subsidiary, Currency, Department, and Class.
- Click the Go icon
 in the POV to apply the changes.
- To analyze the key metrics in the KPIs subform:
- From the Tracker list in the KPIs subform, select one of the following options:
- To display the graph by value, select Amount.
- To display the graph by percentage of the total revenue, select % of Total Revenue.
- Click the Go icon
 in the KPIs subform to apply the changes. The graph displays the Gross Profit, EBITDA, EBIT, and Net Income trends.
- Hover over a series line in the graph to display the series name, period (group), and value.
- To analyze the Gross Profit trend with the Revenue Drill subform:
- From the Tracker list in the Revenue Drill subform, select one of the following options:
- To display the graph by value, select Amount.
- To display the graph by percentage of the total revenue, select % of Total Revenue.
- Click the Go icon
 in the Revenue Drill subform to apply the changes. The graph displays the Gross Profit trend.
- Hover over a series line in the graph to display the series name, period (group), and value.
- (Optional) Click the line in the graph or click Gross Profit in the legend to drill into the trend. Drill further to display the Income and Cost of Goods Sold at Account level.
- To analyze the Expense trends with the Expense Drill subform:
- From the Tracker list in the Expense Drill subform, select one of the following options:
- To display the graph by value, select Amount.
- To display the graph by percentage of total expenses, select % of Total Expenses.
- To display the graph by percentage of the total revenue, select % of Total Revenue.
- Click the Go icon
 in the Expense Drill subform to apply the changes. The graph displays the total Expense trend.
- Hover over a series line in the graph to display the series name, period (group), and value.
- (Optional) Click the line in the graph or click Expense in the legend to drill into the Expense trend. Drill further to display expense trends by expense type and at Account level.
Related Topics
- Working With Financial Statement Dashboards
- Analyzing Trends in the Cash Cycle Dashboard
- Analyzing Trends in the Balance Sheet Dashboard
- Analyzing Trends in the Cash Flow Dashboard


![]() and Refresh icon in each subform
and Refresh icon in each subform ![]() , respectively.
, respectively.